SMOKING & TOBACCO CESSATION INTERVENTION
 The percentages below represent the number of our patients who were identified as a smoker and or tobacco user and received cessation intervention.
The patients must have been seen for at least 2 office visits during that period and be 18 years old or older. 1st Quarter 2013,27.8% 2nd Quarter 2013,39.0% 3rd Quarter 2013,39.9% 4th Quarter 2013, 48.2% 1st Quarter 2014, 57.20% 2nd Quarter 2014, 55.8% 3rd Quarter 2014, 94.0% 4th Quarter 2014, 93.0% 1st Quarter 2015, 81.0%
CERVICAL CANCER SCREENING
 The percentages below represent the number of female patients in our practice between the ages of 23 and 63, who were seen for one visit within the last 2 years preceding the end of the measurement period, who have not had a hysterectomy, and who have had a pap test resulted within the 3 years preceding the measurement period end date.
1st Quarter 2013, 32.0% 2nd Quarter 2013, 59.3% 3rd Quarter 2013, 64.3% 4th Quarter 2013, 44.5% 1st Quarter 2014, 45.8% 2nd Quarter 2014, 49.7% 3rd Quarter 2014, 65.0% 4th Quarter 2014 63.0% 1st Quarter 2015, 57.0%
BREAST CANCER SCREENING
 The percentages listed below represent the number of women in our practice who are age 40 to 69, who have had a visit within 2 years of the end date of the measurement period, who have not have a mastectomy, and who received a mammogram within 2 years of the end date of the measurement period.
1st Quarter 2013, 44.3% 2nd Quarter 2013 46.2% 3rd Quarter 2013, 55.9% 4th Quarter 2013, 62.5% 1st Quarter 2014, 62.7% 2nd Quarter 2014, 68.7% 3rd Quarter 2014, 94.0% 4th Quarter 2014, 86.0% , 1st Quarter 2015, 82%
PATIENTS WITH HYPERTENSION WHO HAVE ADEQUATE CONTROL
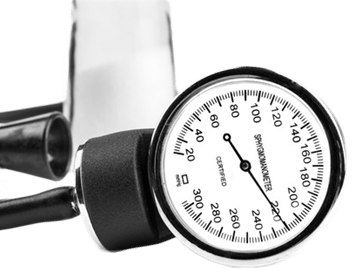
 The percentages below represent our patients who are age 17 to 84 years of age, who were diagnosed with hypertension within 6 months after the start date of the measurement and seen at least once, who’s diastolic blood pressure is less than 90 mmHg and who’s systolic blood pressure is less than 140 mmHg.
1st Quarter 2013, 51.4% 2nd Quarter 2013, 59.3% 3rd Quarter 2013, 64.3% 4th Quarter 2013, 55.3% 1st Quarter 2014, 57.2% 2nd Quarter 2014, 62.5% 3rd Quarter 2014, 66.0% 4th Quarter 2014, 67.0%, 1st Quarter 2015, 66.0%
DIABETIC PATIENTS WHO HAD THEIR LDL-C LESS THAN 100mg/dL
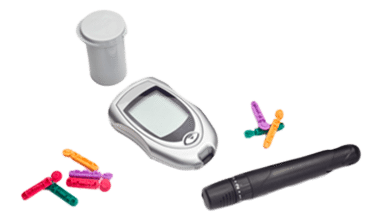
 The percentages below represent our diabetic patients between the ages of 18 & 75 years of age, who were seen at least two times on different dates in the 2 years preceding the end of the reporting period, who had a LDL-C performed and who’s most recent laboratory result for the LDL-C was less than 100mg/Dl.
1st Quarter 2013, 63.3% 2nd Quarter 2013, 60.2% 3rd Quarter 2013, 60.7% 4th Quarter 2013, 64.4% 1st Quarter 2014, 16.37% 2nd Quarter 2014 20.4% 3rd Quarter 2014 18.0% 4th Quarter 2014, 19.0%, 1st Quarter 2015, 17.0%
DIABETIC PATIENTS WHOSE HbgA1c WAS GREATER THAN 9%
 The percentages below represent our diabetic patients who are 17 to 74 years of age, were seen at least two times on different dates in the 2 years preceding the end of the reporting period, and whose most recent laboratory result for HbgA1c was greater than 9%.
1st Quarter 2013, 2.9% 2nd Quarter 2013, 4.1% 3rd Quarter 2013, 3.9% 4th Quarter 2013, 4.0% 1st Quarter 2014, 6.1% 2nd Quarter 2014, 4.2% 3rd Quarter 2014, 8.0 % 4th Quarter 2014 8.0%, 1st Quarter 2015, 9.0%
